
Monetary history · U.S. benchmark · 1850–2025
Gold in hours of pay.
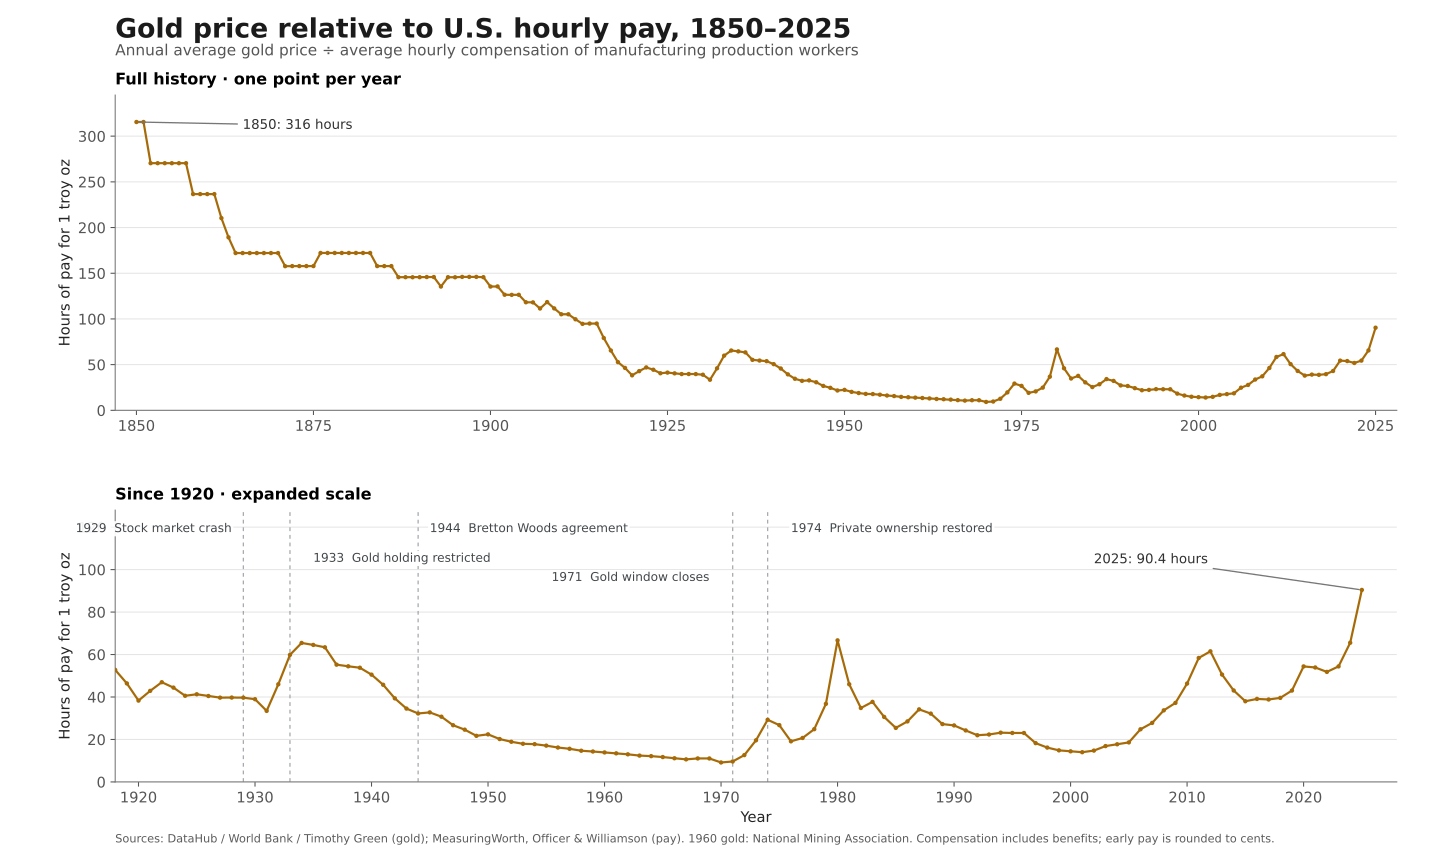
Compare the annual average dollar price of one troy ounce of gold with the same year’s average hourly compensation for U.S. manufacturing production workers.
- 1850 · hours per troy ounce
- 315.5
- 2025 · hours per troy ounce
- 90.4
- Annual observations
- 176
The annotated chart
One ounce, measured in hours.
On a small screen, swipe across the chart or focus it and use the arrow keys. The full-size SVG supports closer inspection.
Read the comparison
Price ÷ hourly compensation.
Both inputs are nominal U.S. dollars for the same year. Dividing dollars per troy ounce by dollars per hour produces hours per troy ounce.
2025: $3,442.00 per troy ounce ÷ $38.07 per hour = 90.4 hours per troy ounce.
Early compensation observations are reported to the nearest cent. This rounding creates visible steps in the nineteenth-century ratio. The historical series combines sources that change over time.
The comparison describes published gold and compensation benchmarks. Coin premiums, taxes, ownership restrictions, and household spending needs are outside the calculation.
The five markers
Monetary history alongside the data.
- 1929
- 1933
Gold holding restricted
U.S. restrictions covered monetary gold, with licensing and exceptions for uses such as industry. The chart label is shorthand for those restrictions.
Federal Reserve History ↗ - 1944
Bretton Woods agreement
The international monetary framework was agreed in July 1944. Full currency convertibility followed later.
Federal Reserve History ↗ - 1971
Gold window closes
In August 1971, the United States ended dollar-to-gold convertibility for foreign monetary authorities.
Federal Reserve History ↗ - 1974
Private ownership restored
The lifting of restrictions on private gold ownership took effect on December 31, 1974.
U.S. Mint / Treasury statement ↗
Inspect the observations
The annual data.
Show all 176 annual observations, 1850–2025
| Year | Gold · USD / troy oz | Compensation · USD / hour | Hours / troy oz |
|---|---|---|---|
| 1850 | $18.93 | $0.06 | 315.5 |
| 1851 | $18.93 | $0.06 | 315.5 |
| 1852 | $18.93 | $0.07 | 270.4 |
| 1853 | $18.93 | $0.07 | 270.4 |
| 1854 | $18.93 | $0.07 | 270.4 |
| 1855 | $18.93 | $0.07 | 270.4 |
| 1856 | $18.93 | $0.07 | 270.4 |
| 1857 | $18.93 | $0.07 | 270.4 |
| 1858 | $18.93 | $0.08 | 236.6 |
| 1859 | $18.93 | $0.08 | 236.6 |
| 1860 | $18.93 | $0.08 | 236.6 |
| 1861 | $18.93 | $0.08 | 236.6 |
| 1862 | $18.93 | $0.09 | 210.3 |
| 1863 | $18.93 | $0.10 | 189.3 |
| 1864 | $18.93 | $0.11 | 172.1 |
| 1865 | $18.93 | $0.11 | 172.1 |
| 1866 | $18.93 | $0.11 | 172.1 |
| 1867 | $18.93 | $0.11 | 172.1 |
| 1868 | $18.93 | $0.11 | 172.1 |
| 1869 | $18.93 | $0.11 | 172.1 |
| 1870 | $18.93 | $0.11 | 172.1 |
| 1871 | $18.93 | $0.12 | 157.8 |
| 1872 | $18.94 | $0.12 | 157.8 |
| 1873 | $18.94 | $0.12 | 157.8 |
| 1874 | $18.94 | $0.12 | 157.8 |
| 1875 | $18.94 | $0.12 | 157.8 |
| 1876 | $18.94 | $0.11 | 172.2 |
| 1877 | $18.94 | $0.11 | 172.2 |
| 1878 | $18.94 | $0.11 | 172.2 |
| 1879 | $18.94 | $0.11 | 172.2 |
| 1880 | $18.94 | $0.11 | 172.2 |
| 1881 | $18.94 | $0.11 | 172.2 |
| 1882 | $18.94 | $0.11 | 172.2 |
| 1883 | $18.94 | $0.11 | 172.2 |
| 1884 | $18.94 | $0.12 | 157.8 |
| 1885 | $18.94 | $0.12 | 157.8 |
| 1886 | $18.94 | $0.12 | 157.8 |
| 1887 | $18.94 | $0.13 | 145.7 |
| 1888 | $18.94 | $0.13 | 145.7 |
| 1889 | $18.93 | $0.13 | 145.6 |
| 1890 | $18.94 | $0.13 | 145.7 |
| 1891 | $18.96 | $0.13 | 145.8 |
| 1892 | $18.96 | $0.13 | 145.8 |
| 1893 | $18.96 | $0.14 | 135.4 |
| 1894 | $18.94 | $0.13 | 145.7 |
| 1895 | $18.93 | $0.13 | 145.6 |
| 1896 | $18.98 | $0.13 | 146.0 |
| 1897 | $18.98 | $0.13 | 146.0 |
| 1898 | $18.98 | $0.13 | 146.0 |
| 1899 | $18.94 | $0.13 | 145.7 |
| 1900 | $18.96 | $0.14 | 135.4 |
| 1901 | $18.98 | $0.14 | 135.6 |
| 1902 | $18.97 | $0.15 | 126.5 |
| 1903 | $18.95 | $0.15 | 126.3 |
| 1904 | $18.96 | $0.15 | 126.4 |
| 1905 | $18.92 | $0.16 | 118.3 |
| 1906 | $18.90 | $0.16 | 118.1 |
| 1907 | $18.94 | $0.17 | 111.4 |
| 1908 | $18.95 | $0.16 | 118.4 |
| 1909 | $18.96 | $0.17 | 111.5 |
| 1910 | $18.92 | $0.18 | 105.1 |
| 1911 | $18.92 | $0.18 | 105.1 |
| 1912 | $18.93 | $0.19 | 99.6 |
| 1913 | $18.92 | $0.20 | 94.6 |
| 1914 | $18.99 | $0.20 | 94.9 |
| 1915 | $18.99 | $0.20 | 94.9 |
| 1916 | $18.99 | $0.24 | 79.1 |
| 1917 | $18.99 | $0.29 | 65.5 |
| 1918 | $18.99 | $0.36 | 52.8 |
| 1919 | $19.95 | $0.43 | 46.4 |
| 1920 | $20.68 | $0.54 | 38.3 |
| 1921 | $20.58 | $0.48 | 42.9 |
| 1922 | $20.66 | $0.44 | 47.0 |
| 1923 | $21.32 | $0.48 | 44.4 |
| 1924 | $20.69 | $0.51 | 40.6 |
| 1925 | $20.64 | $0.50 | 41.3 |
| 1926 | $20.63 | $0.51 | 40.5 |
| 1927 | $20.64 | $0.52 | 39.7 |
| 1928 | $20.66 | $0.52 | 39.7 |
| 1929 | $20.63 | $0.52 | 39.7 |
| 1930 | $20.65 | $0.53 | 39.0 |
| 1931 | $17.06 | $0.51 | 33.5 |
| 1932 | $20.69 | $0.45 | 46.0 |
| 1933 | $26.33 | $0.44 | 59.8 |
| 1934 | $34.69 | $0.53 | 65.5 |
| 1935 | $34.84 | $0.54 | 64.5 |
| 1936 | $34.87 | $0.55 | 63.4 |
| 1937 | $34.79 | $0.63 | 55.2 |
| 1938 | $34.85 | $0.64 | 54.5 |
| 1939 | $34.42 | $0.64 | 53.8 |
| 1940 | $33.85 | $0.67 | 50.5 |
| 1941 | $33.85 | $0.74 | 45.7 |
| 1942 | $33.85 | $0.86 | 39.4 |
| 1943 | $33.85 | $0.98 | 34.5 |
| 1944 | $33.85 | $1.05 | 32.2 |
| 1945 | $34.71 | $1.06 | 32.7 |
| 1946 | $34.71 | $1.13 | 30.7 |
| 1947 | $34.71 | $1.30 | 26.7 |
| 1948 | $34.71 | $1.41 | 24.6 |
| 1949 | $31.69 | $1.46 | 21.7 |
| 1950 | $34.72 | $1.55 | 22.4 |
| 1951 | $34.72 | $1.72 | 20.2 |
| 1952 | $34.60 | $1.83 | 18.9 |
| 1953 | $34.84 | $1.94 | 18.0 |
| 1954 | $35.04 | $1.97 | 17.8 |
| 1955 | $35.03 | $2.05 | 17.1 |
| 1956 | $34.99 | $2.16 | 16.2 |
| 1957 | $34.95 | $2.24 | 15.6 |
| 1958 | $35.10 | $2.39 | 14.7 |
| 1959 | $35.10 | $2.45 | 14.3 |
| 1960 | $35.27 NMA | $2.54 | 13.9 |
| 1961 | $35.00 | $2.60 | 13.5 |
| 1962 | $35.23 | $2.71 | 13.0 |
| 1963 | $35.09 | $2.83 | 12.4 |
| 1964 | $35.10 | $2.89 | 12.1 |
| 1965 | $35.12 | $3.00 | 11.7 |
| 1966 | $35.00 | $3.14 | 11.1 |
| 1967 | $34.95 | $3.29 | 10.6 |
| 1968 | $38.93 | $3.52 | 11.1 |
| 1969 | $41.08 | $3.72 | 11.0 |
| 1970 | $36.00 | $3.93 | 9.2 |
| 1971 | $41.00 | $4.26 | 9.6 |
| 1972 | $58.00 | $4.59 | 12.6 |
| 1973 | $97.00 | $4.95 | 19.6 |
| 1974 | $159.25 | $5.44 | 29.3 |
| 1975 | $161.00 | $6.02 | 26.7 |
| 1976 | $124.82 | $6.53 | 19.1 |
| 1977 | $148.00 | $7.15 | 20.7 |
| 1978 | $193.00 | $7.77 | 24.8 |
| 1979 | $306.67 | $8.34 | 36.8 |
| 1980 | $608.00 | $9.12 | 66.7 |
| 1981 | $460.00 | $10.00 | 46.0 |
| 1982 | $376.00 | $10.80 | 34.8 |
| 1983 | $423.00 | $11.22 | 37.7 |
| 1984 | $360.48 | $11.78 | 30.6 |
| 1985 | $318.00 | $12.50 | 25.4 |
| 1986 | $367.69 | $12.90 | 28.5 |
| 1987 | $446.00 | $13.05 | 34.2 |
| 1988 | $437.00 | $13.58 | 32.2 |
| 1989 | $381.43 | $14.00 | 27.2 |
| 1990 | $383.47 | $14.41 | 26.6 |
| 1991 | $362.00 | $14.93 | 24.2 |
| 1992 | $343.73 | $15.63 | 22.0 |
| 1993 | $360.00 | $16.12 | 22.3 |
| 1994 | $384.00 | $16.56 | 23.2 |
| 1995 | $384.00 | $16.66 | 23.0 |
| 1996 | $388.00 | $16.84 | 23.0 |
| 1997 | $331.10 | $18.12 | 18.3 |
| 1998 | $294.00 | $18.18 | 16.2 |
| 1999 | $278.77 | $18.75 | 14.9 |
| 2000 | $279.00 | $19.36 | 14.4 |
| 2001 | $270.99 | $19.36 | 14.0 |
| 2002 | $310.00 | $21.02 | 14.7 |
| 2003 | $363.51 | $21.54 | 16.9 |
| 2004 | $409.00 | $23.07 | 17.7 |
| 2005 | $445.00 | $23.92 | 18.6 |
| 2006 | $604.00 | $24.37 | 24.8 |
| 2007 | $696.72 | $25.07 | 27.8 |
| 2008 | $872.00 | $25.87 | 33.7 |
| 2009 | $972.97 | $26.15 | 37.2 |
| 2010 | $1,224.66 | $26.44 | 46.3 |
| 2011 | $1,569.21 | $26.88 | 58.4 |
| 2012 | $1,670.00 | $27.15 | 61.5 |
| 2013 | $1,411.46 | $27.92 | 50.6 |
| 2014 | $1,266.00 | $29.40 | 43.1 |
| 2015 | $1,160.66 | $30.55 | 38.0 |
| 2016 | $1,248.99 | $31.95 | 39.1 |
| 2017 | $1,257.56 | $32.39 | 38.8 |
| 2018 | $1,269.00 | $32.06 | 39.6 |
| 2019 | $1,392.50 | $32.36 | 43.0 |
| 2020 | $1,770.00 | $32.54 | 54.4 |
| 2021 | $1,799.63 | $33.39 | 53.9 |
| 2022 | $1,801.00 | $34.76 | 51.8 |
| 2023 | $1,943.00 | $35.72 | 54.4 |
| 2024 | $2,387.70 | $36.43 | 65.5 |
| 2025 | $3,442.00 | $38.07 | 90.4 |
Sources & scope
Keep the benchmarks attached.
- Gold: DataHub annual gold prices, combining Timothy Green’s historical table and World Bank Commodity Markets data. The supplied DataHub download omitted 1960; that year’s $35.27 value comes from the National Mining Association historical gold-price table.
- Compensation: Lawrence H. Officer and Samuel H. Williamson, “Annual Wages in the United States, 1774–Present,” MeasuringWorth, manufacturing production-worker hourly compensation, including benefits.
- Snapshot: Chart and 176-row CSV supplied by the Metals research chat on . Coverage ends in 2025. Source and historical-marker links reviewed on that date.
DataHub labels its dataset ODC-PDDL. MeasuringWorth permits non-profit educational use with credit and asks users to seek permission for other uses. Its terms also govern reuse of the compensation data behind this chart.